When you develop an application, sooner or later you have to deal with its performance. To ensure application performance you have to think over its architecture, pick necessary components and use them correctly. Otherwise, on late stages of development, when you have a lot of code, improving performance becomes a complex task requiring changes of working and debugged code.
We also provide a very useful tutorial based on the experience of developing high-performance applications and practical recommendations on do’s and don’ts.

In this section we describe features of Dapfor grid that help to evaluate its performance and to understand, which modes should be used for specific applications.
Test configuration:
- Intel Core 2 Quad Q6600 2.40 GHz, Memory : 2 GB, OS Windows Vista SP2, display resolution: 1920х1280
- Tested grid dimensions: 1890х813. During all tests the grid is always visible on the screen.
Test results may vary for different computers or when visible grid dimensions are change. You can download benchmarking application here. Source codes of this application are available here.
Let’s say some general things about application performance. A running application consumes resources to recalculate and repaint data using GDI/GDI+ tools. Both operations are not linked with each other. Under recalculation we mean sorting, filtering, grouping and all other operations except repainting. All these operations in a grid are performed only in GUI thread. If data changes in another thread, the grid performs the required synchronization, usually synchronous data transfer to GUI thread. Event-driven may feature asynchronous transfer of notifications when the calling thread is not blocked. Both data recalculation and repainting consume CPU resources in different proportions with different number of rows. If there are a few rows, repainting is the most resource-intensive task because most rows are contained in the visible part of the grid that requires intense repainting. When there are more rows, only few of them are in the visible area, therefore, repainting consumes less resources.
Let’s also note that these benchmarks show maximum parameters for grid performance. It doesn’t mean that every application will operate in such stress environment. Besides, it is hard to imagine a situation when every cell in the visible part of grid (there may be over 500 of them) will be updated at a rate of over 10 updates per second. In real-life applications this value doesn’t exceed 1-2 updates for 5-10 cells per second. Data provided below enables a developer to evaluate application performance range in the beginning of project and to start creating code knowing, which mode is the best to use our visual components.
Performance of data insertion into a grid
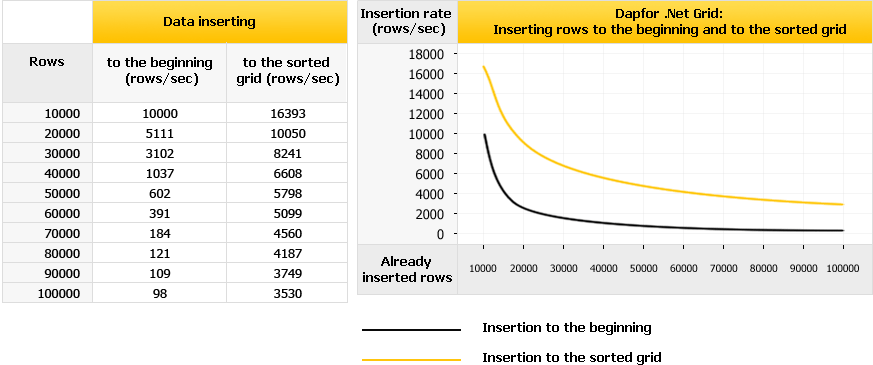
It is most efficient to insert elements in the end of the grid (this is true for all grids). This method of adding data basically doesn’t depend on the number of already inserted elements. Adding data to the beginning of grid or to a sorted grid heavily depends on the number of already inserted elements. This is especially true for insertion to the beginning of a grid, which should be avoided.
Inserting data to the beginning and sorted grid:
Inserting data to the end:

Removing data
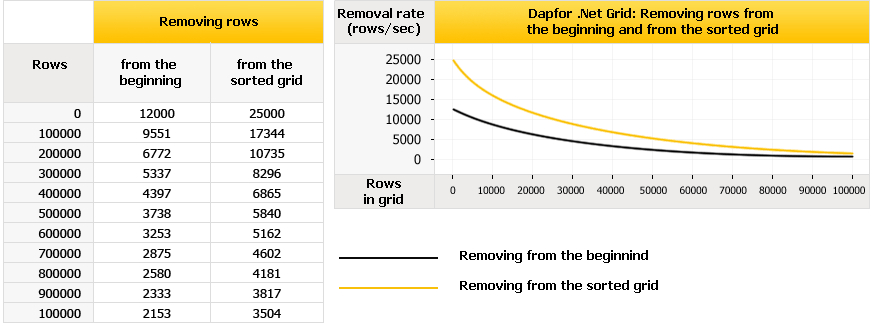
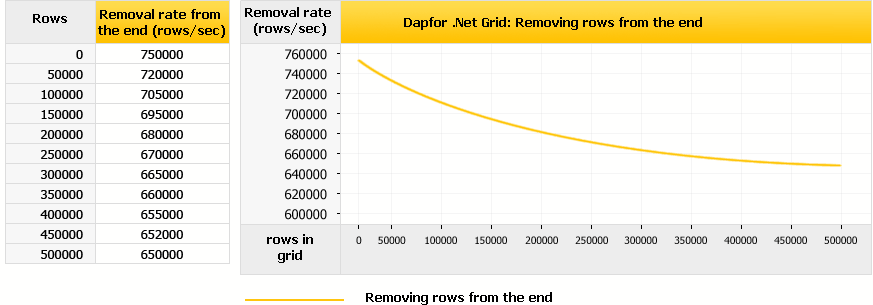
Data removal is also an important characteristic of a grid. Slow removal of data may cause application crashing, especially when they are closed. It is most efficient to remove data from the end of the grid. Data removal rate doesn’t depend much on data volume. It is better to avoid data removal from the beginning of grid or from a sorted grid because these methods are efficient only for low data volumes. Hint: To speed up data removal, cancel sorting with Header.SortedColumns.Clear().
Removing data from the beginning and sorted grid:
Removing data from the end:
Updating data in non-event model
This model assumes that data doesn’t implement INotifyPropertyChanged interface. Example:
| C# | |
|---|---|
grid.Rows.Add(new object[]{"value1", 123, true, DateTime.Now}); //Data is updated by calling Cell.Value property. Row row = ...; Cell cell = row[0] ; cell.Value = "value2"; | |
This property can be called from any thread, not just from GUI thread. In this case the grid synchronizes threads with synchronous call of Control.Invoke().
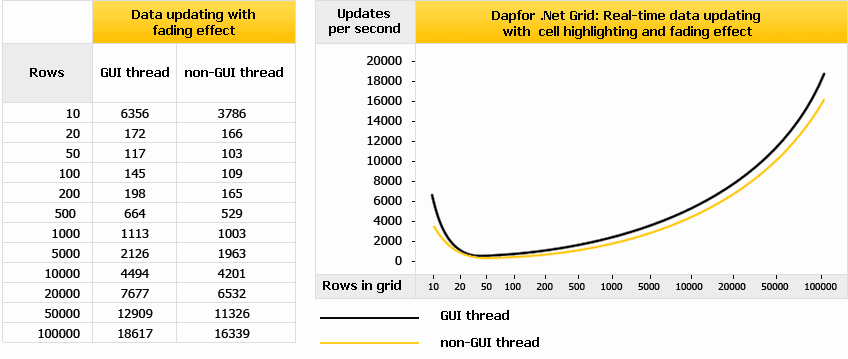
Maximum data update rate heavily depends on data volume. When there are a lot of rows, updating speed increases because there are less updates in the visible area. When the number of rows increases as does overall updating rate, data synchronization between threads puts more load on CPU from non-GUI thread.
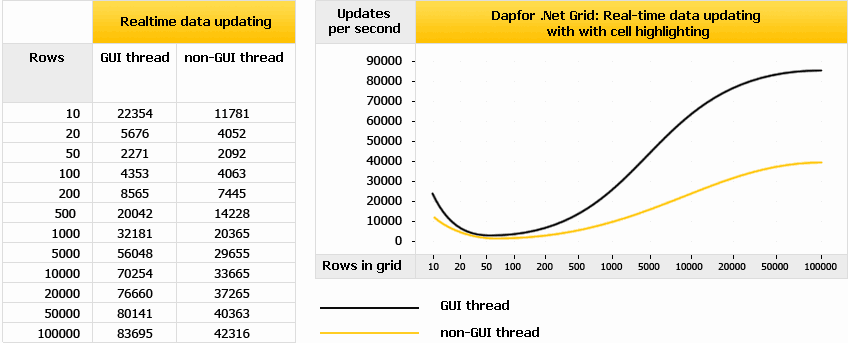
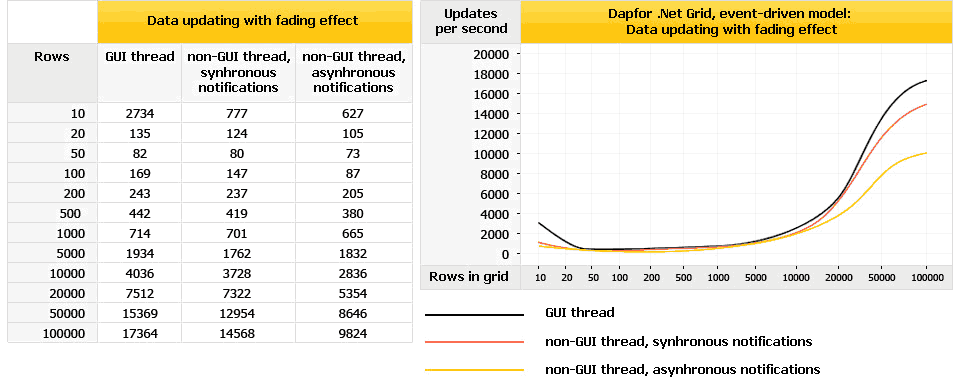
It’s worth mentioning that fading effect, when every cell is repainted every 30 ms with color change, has a negative impact on performance and should not be used in real-time applications.
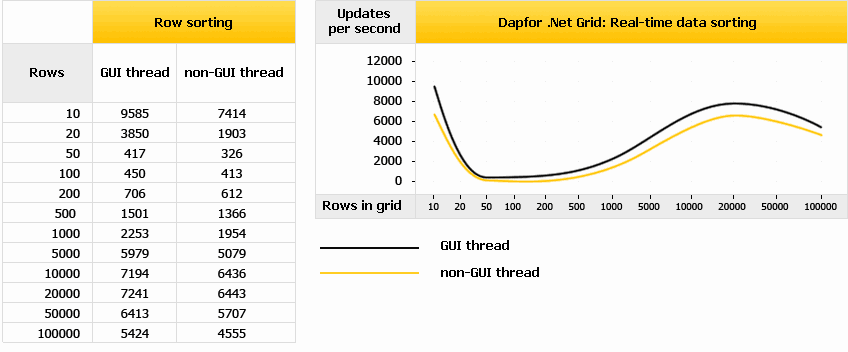
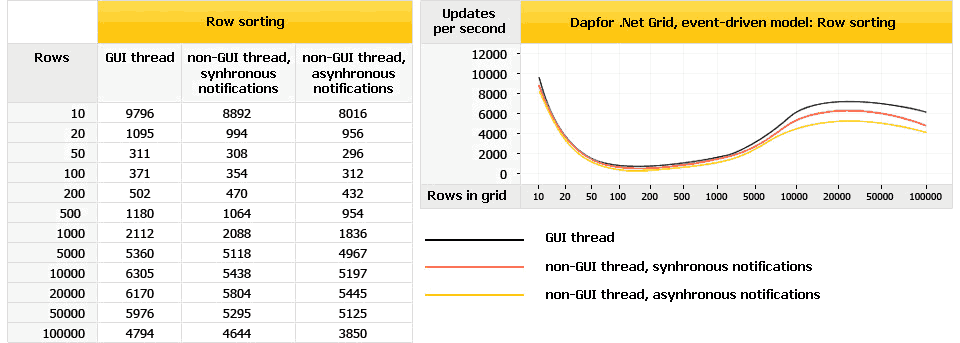
Real-time sorting speed also heavily depends on the number of rows and on vertical scrollbar position. In the middle of a grid sorting of one row requires repainting of many neighboring rows that also change their positions during rotation.
Updating data in an event-driven model
This model enables working with data implementing INotifyPropertyChanged interface.
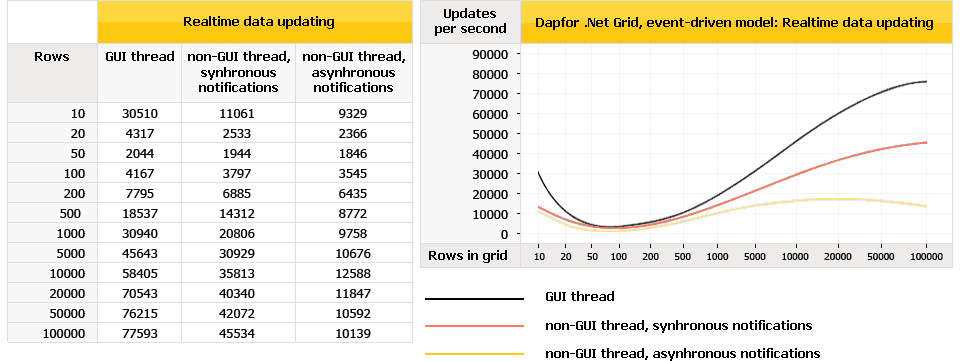
In general, grid characteristics in this mode are similar to non-event mode. The main distinction is the ability to synchronize data with asynchronous call that doesn’t block the called thread. This synchronization method consumes more resources, however it is more thread-safe and helps to prevent thread deadlocks.
Data grouping
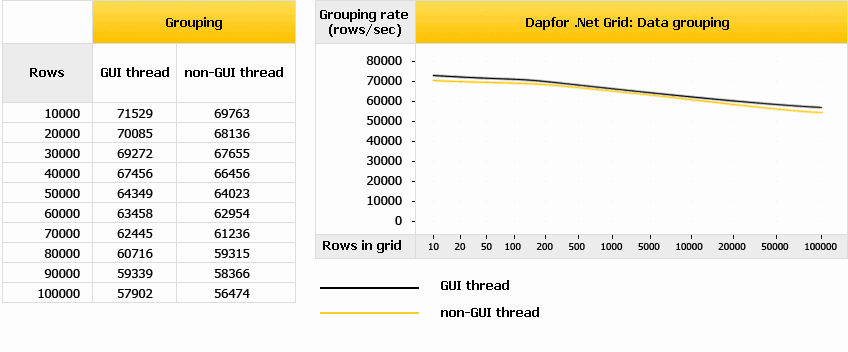
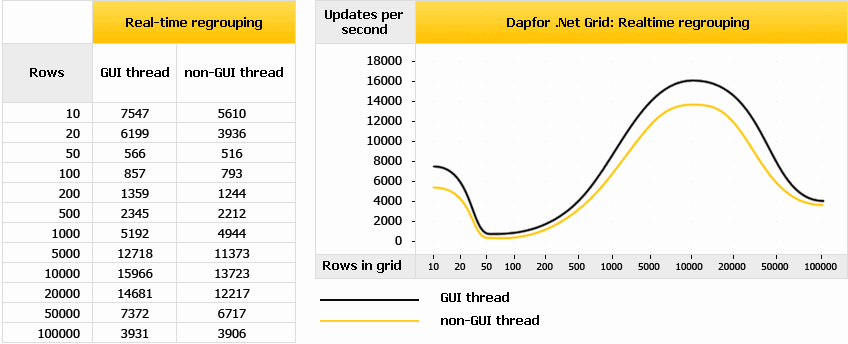
Below we provide grid characteristics for static and real-time data grouping. During static grouping a grid rebuilds content for all data in the grid, while dependence of grouping rate on data volume is measured. During dynamic grouping data is changed in real-time, and this requires searching for existing groups, creating new groups and removing groups that contain no more rows. To understand the performance chart for dynamic data regrouping, remember that when there are a few rows, they have to be repainted frequently, and when there are many rows, more resources are consumed for searching or creating groups.
Dynamic filtering
Filtering manages row visibility. A developer may set his own filters to manage filtering. Every time when new data is added to a grid or when data is modified, the grid checks whether this data meets filtering conditions.
Performance heavily depends on the number of rows and on vertical scrollbar position. When the thumb is in the middle, grid has to repaint more rows because when visibility status of a higher-standing row changes, all the following rows change their positions.
