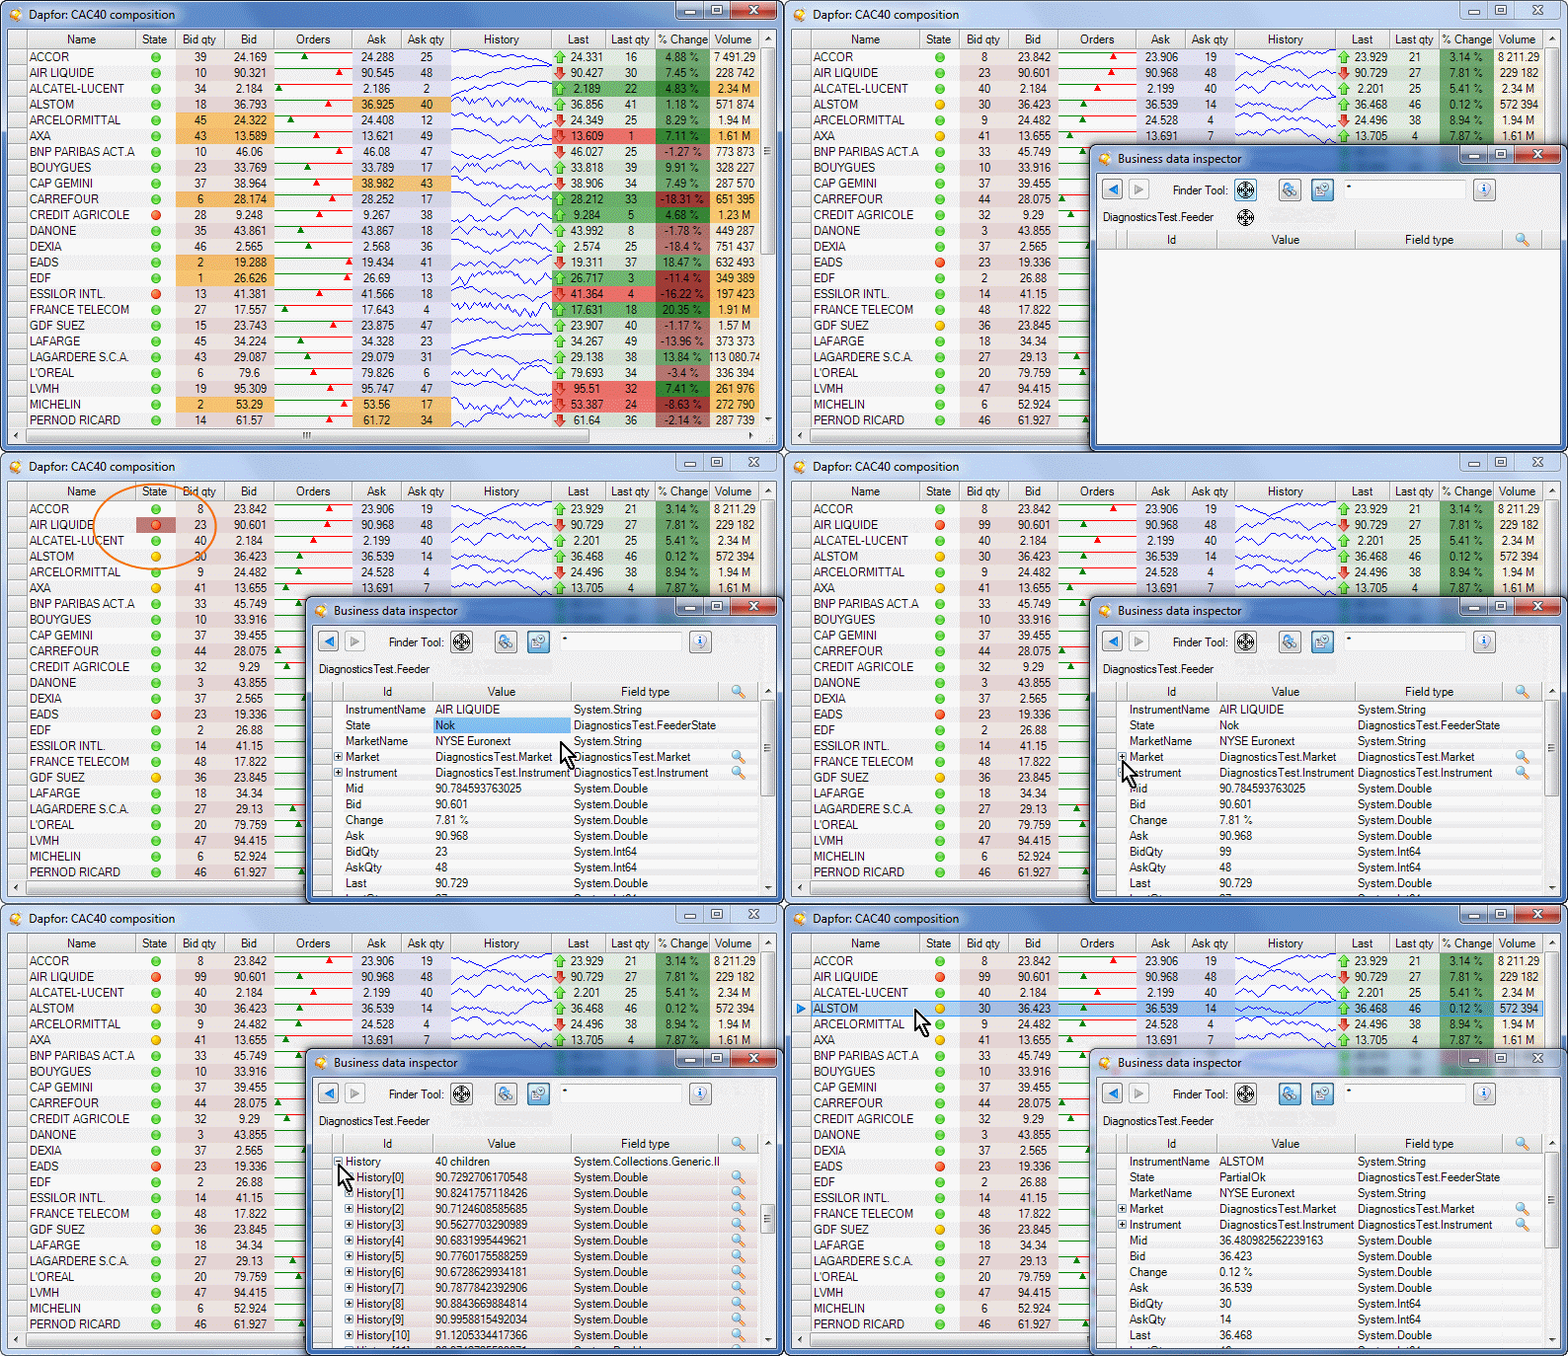
During development programmers continuously debug their applications. For this purpose they set breakpoints in application code (if there are *.pdb files) or record data to log files or console. When an application reaches the breakpoint, it totally stops and the programmer can view variable values and call stacks for each application thread making so-called snapshot. If an application has no *.pdb files or if it is running not in IDE and there is no way to attach a debugger to a running process, debugging is impossible. Debugging may become harder because of a large number of threads, timers and inter-thread object interaction.
Besides application graphics components, Dapfor .Net library also contains powerful tools for debugging applications from inside. Applications use data objects that constitute application business logic. These objects interact with each other and some of them can be displayed in graphical controls. .Net Inspector is a tool for debugging such objects. It enables displaying contents of all data object properties, and if these properties have setters, it can modify their values using most suitable editors. Inspector can also be used to navigate to other objects, referenced in properties of inspected object and to perform the same manipulations with these objects. It all happens in real-time mode without stopping the application. It is important that no *.pdb files are required.
Getting data objects from .Net Grid
.Net Grid uses object model, where the data level doesn’t depend on data presentation from the point of project structure or from the point of thread safety. This data may include objects of arbitrary classes that exist and interact in the application. Data object may be different, may have different structure and may contain references to other objects that might be not present in GUI but that play a functional role in the application. This data can also be in grid rows.
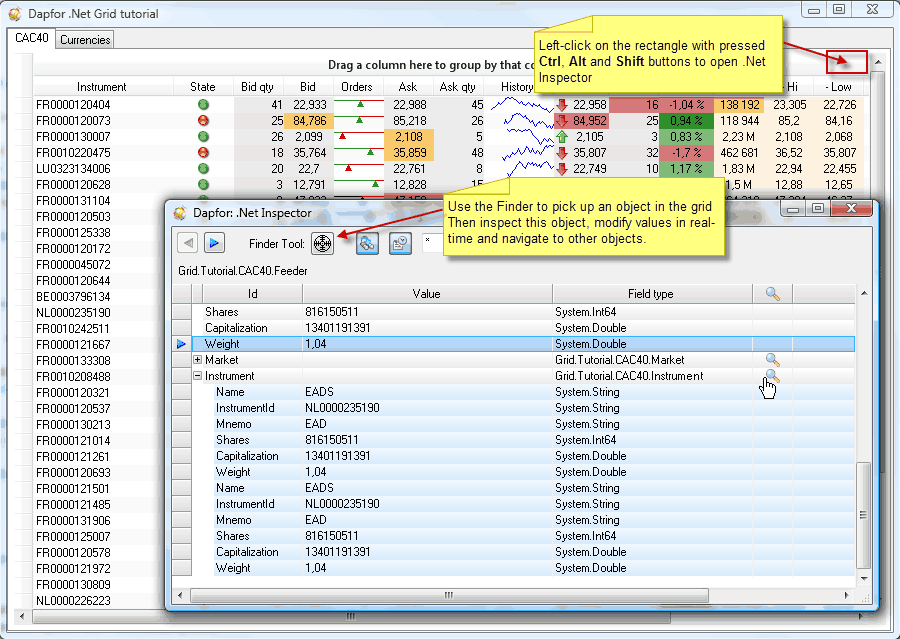
Now let’s explain how to transfer a data object to the inspector. It can be done programmatically with a useful finder utility.

When developer moves finder to a grid row, the object from this row is passed to the inspector. After that the developer has access to all properties of this object, including properties that are not displayed in grid column. The developer may view and edit these properties or navigate to other objects. The developer may also enable piloting mode, in which the Inspector watches for changes of the focused row in the grid and automatically changes the inspected object:

Also you can transfer a data object to the inspector programmatically:
| C# | |
|---|---|
InspectorForm inspector = new InspectorForm();
InspectorForm.Inspect(yourObject);
InspectorForm.Show(); | |
Where and how is it better to create the inspector?
The Inspector is a control that can be placed at any application form. Besides, Dapfor.Net library already contains a topmost form with this control - InspectorForm. For example this form can be created in a menu event handler as shown below:
| C# | |
|---|---|
MenuItem menuInspector = ... menuInspector.Click += delegate { InspectorForm inspector = new InspectorForm(); inspector.Show(this); }; | |
If such menu is undesirable, the developer can create a handler that reacts to a hidden key combination (e.g. Ctrl + Alt + Shift + left mouseclick) and also opens a debugger window. In this case the programmer gets an additional chance to inspect the application and to change its behavior when no other tools can be of help.
An example of creating a global event handler reacting to Ctrl + Alt + Shift + left mouseclick shortcut is shown below:
| C# | |
|---|---|
grid.MouseClick += delegate(object sender, MouseEventArgs e) { Rectangle rc = new Rectangle(grid.ClientRectangle.Width - 20, 0, 20, 20); if (rc.Contains(e.Location) && Equals(e.Button, MouseButtons.Left) && Equals(ModifierKeys, Keys.Control | Keys.Alt | Keys.Shift)) { InspectorForm inspector = new InspectorForm(); inspector.Show(grid); } }; | |
